Every Kilometre Has a Context
Accurate Baselines Require Detailed Service Data
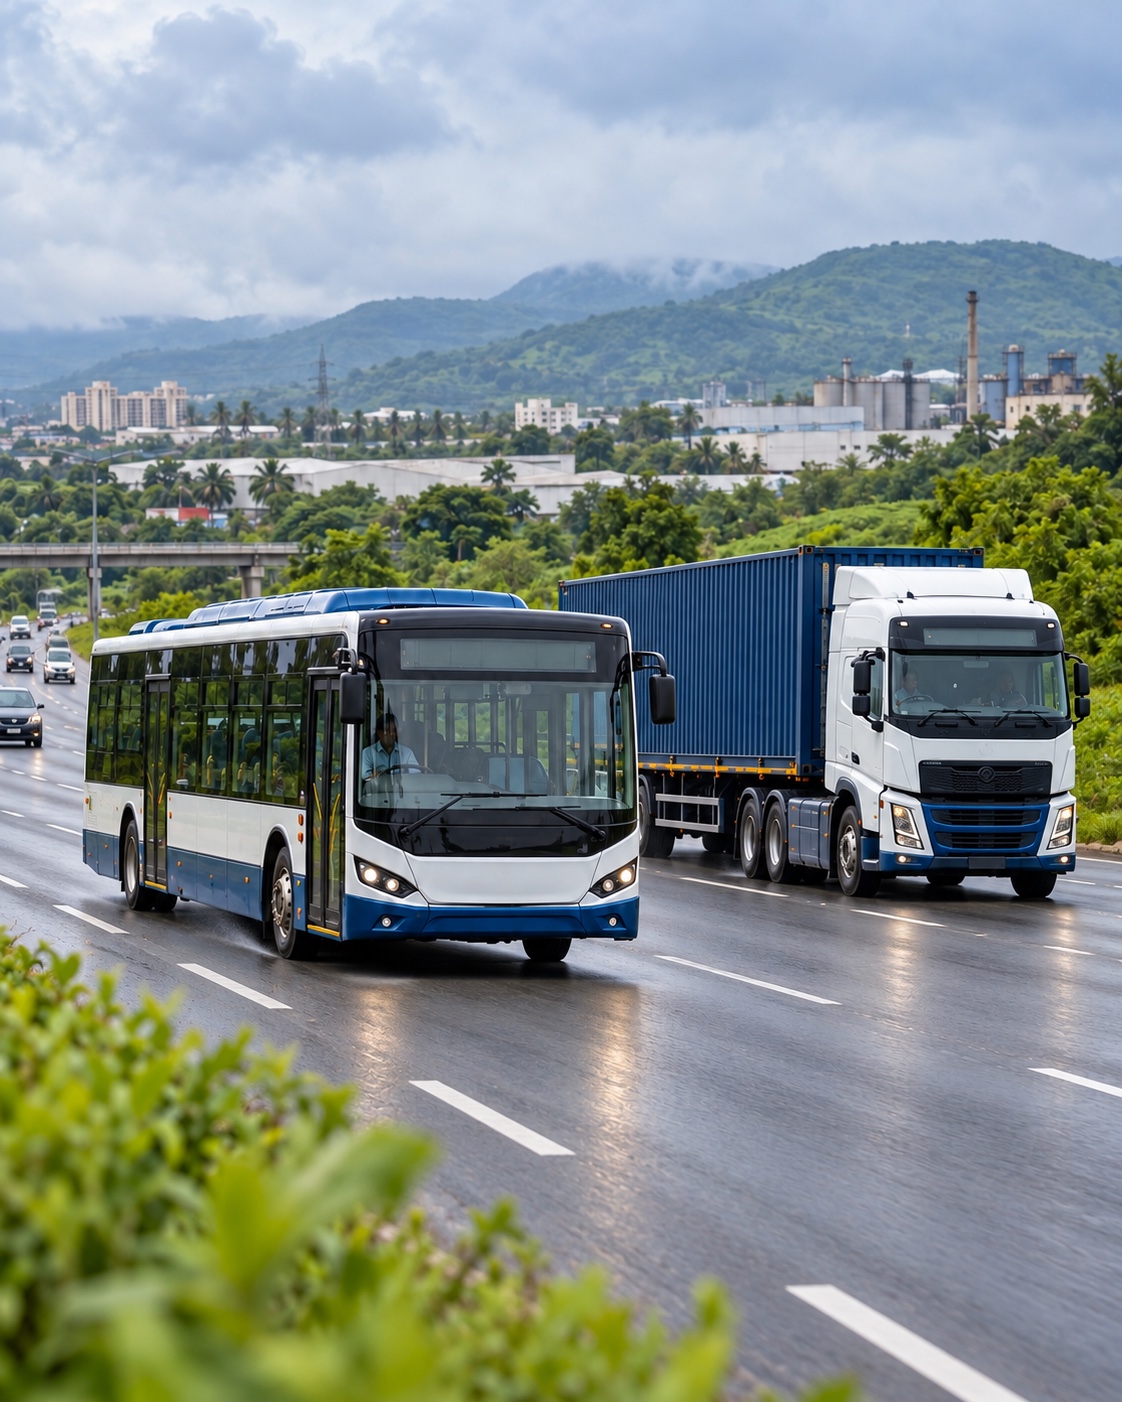
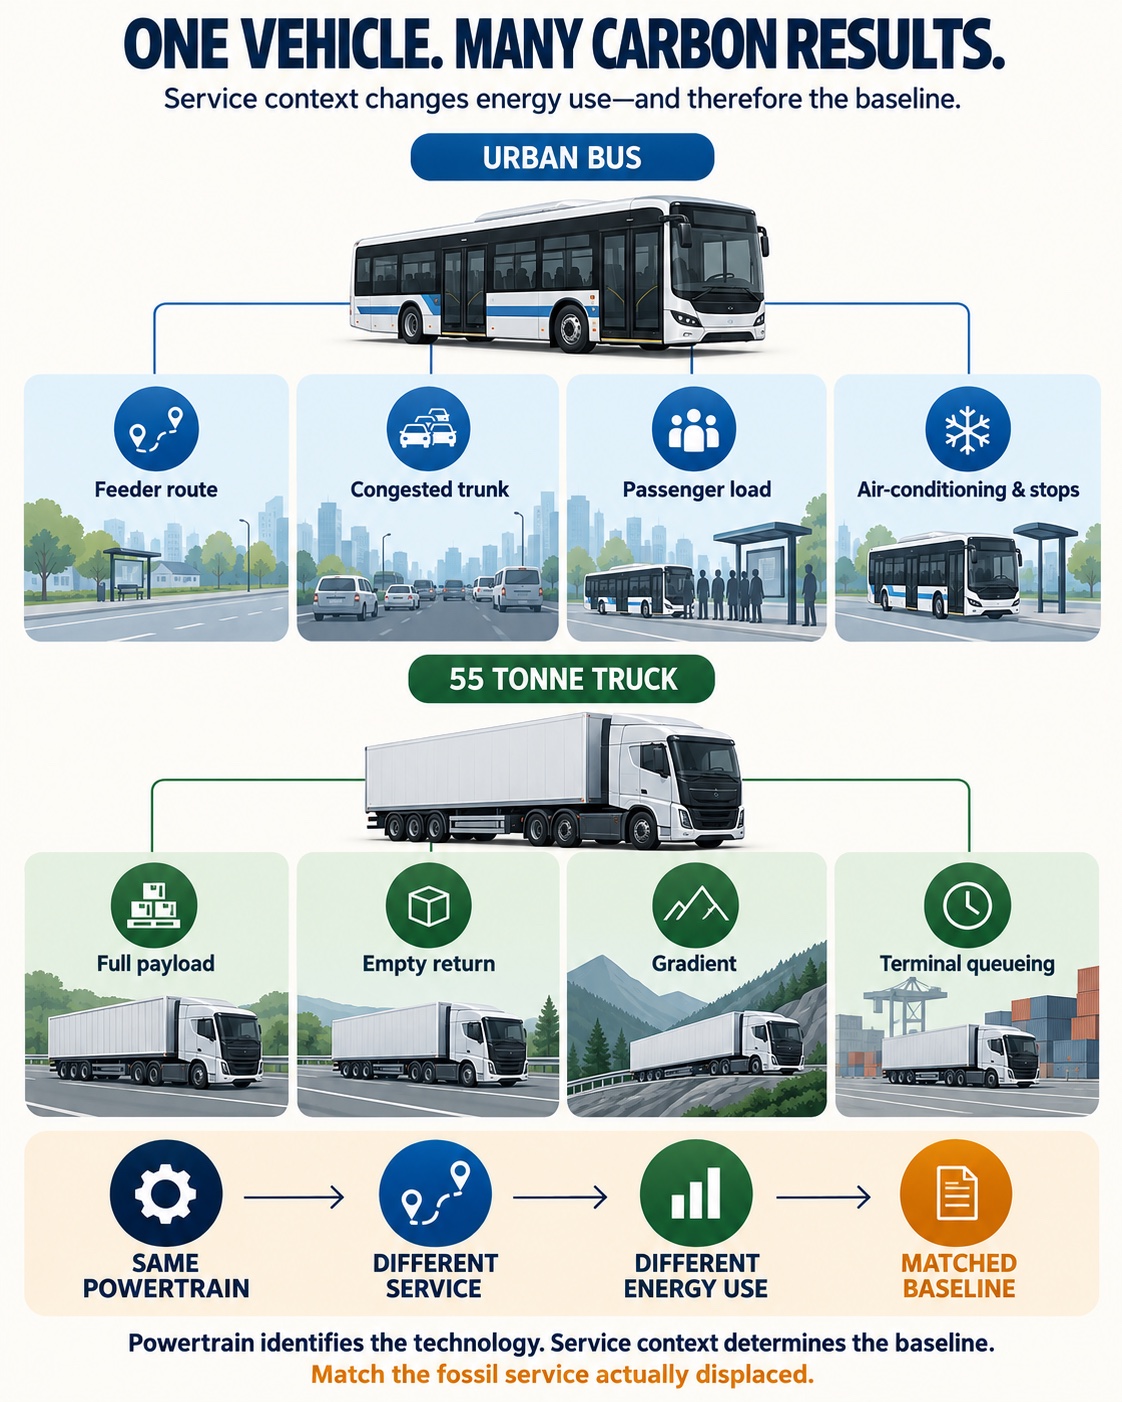
India’s electric buses and trucks operate in varied conditions. A bus may run on a congested main route or a short feeder route. A truck may travel fully loaded, return empty, climb a steep corridor or wait at a terminal. These conditions change how much energy the vehicle uses and therefore its emissions.
A credible baseline therefore compares each electric vehicle with the fossil-fuel service it actually replaces. It uses the most specific reliable data available for the route, load, vehicle and operating conditions.
The central thesis
A baseline that reflects the service an electric vehicle actually replaces produces a more accurate estimate of carbon savings.
A Three-Level Framework for Determining Transport Baselines
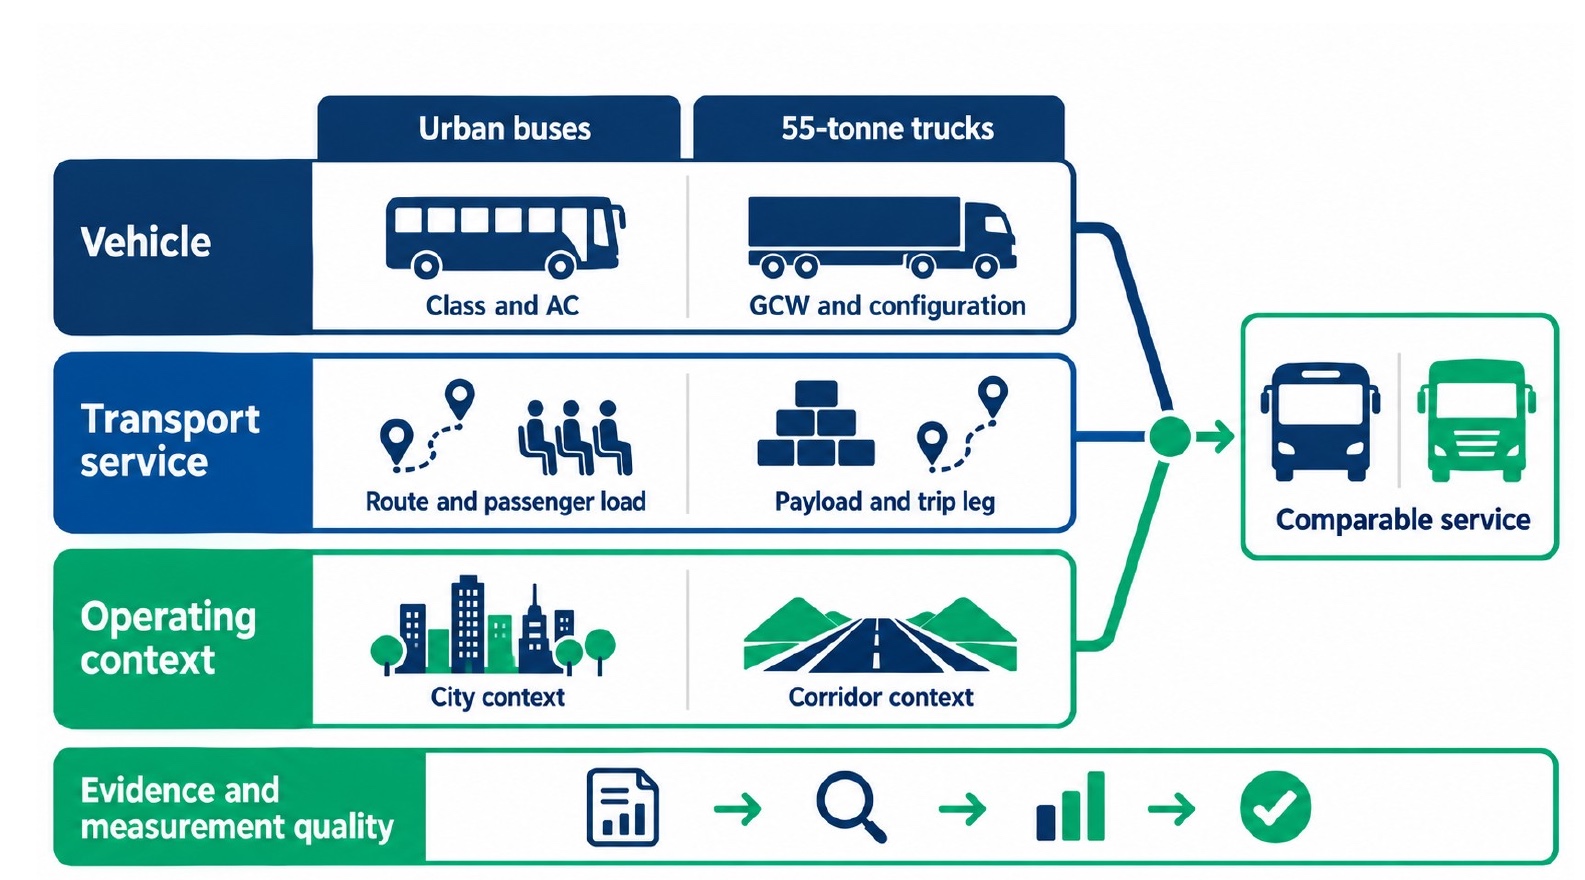
The framework looks at three levels: the vehicle, the service it provides and where it operates. This structure can be applied across modes of transportation.
Variables specific to each mode of transportation should be considered at each level of the framework. For buses, the key factors are vehicle capacity, route, stops and passenger load. For trucks, they are payload, whether the truck is full or empty, the trip leg and the corridor. Considering these variables together produces a baseline that reflects real operating conditions and supports a more accurate estimate of carbon savings.
Evidence Pathways for Buses and Trucks
The framework is grounded in evidence from real-world bus operations and India-specific truck research.
The bus case draws on public records from sixteen Indian cities, including government-audited operator observations. The truck case combines India-specific modelling, load-state assumptions, heavy-truck driving-cycle research and corridor studies. Public 55 tonne truck evidence remains largely modelled, so the paper labels every input as published, modelled, derived, assumed or proposed.
What the Reference Cases Reveal
The study develops illustrative bus and truck cases to show how granular baselines can improve the estimate of carbon savings. Each case matches the electric vehicle with a fossil-fuel service under defined operating conditions.
At the CEA weighted-average electricity factor of 0.675 kg CO₂/kWh, both modelled cases show lower operational emissions.
21.8–24.7%
Electric busModelled reduction in operational emissions against CNG and diesel reference buses.
21.6–28.5%
55 tonne electric truckModelled reduction against the lower and central diesel references.
16
Indian cities reviewedPublic evidence behind the urban bus case, from Delhi and Mumbai to Kochi and Kolkata.
While these cases are illustrative, they demonstrate why granular baselines matter. A well-matched comparison can estimate carbon savings more accurately. In practice, an approved baseline or carbon-credit calculation would require project-specific evidence.
Using broad averages to determine baselines can hide differences in energy demand and may understate the savings achieved in some services. Delhi’s audited FY2021–22 data show that DTC AC CNG buses achieved 2.01 km/kg, compared with 2.33 km/kg for non-AC buses, while the published fleet aggregate was 2.20 km/kg. Applying that aggregate to an AC electric-bus project would make the fossil baseline appear more efficient than the comparable AC service, reducing the carbon savings recognised.
For the detailed cases, assumptions and calculations that demonstrate these effects, see the full paper.
One Accounting Backbone for Every Mode of Transport
Road transport should use one accounting backbone, with separate modules for each mode of transport. The shared backbone keeps the main rules consistent. Each module then captures the vehicle, service and operating variables that matter for that mode.
Granular accounting can recognise carbon savings that broad averages miss. This gives operators an incentive to monitor performance more closely and move towards more specific evidence.
The paper sets out a graduated six-level evidence hierarchy to support this progression. It also covers metering boundaries, renewable electricity rules, claim ownership and leakage checks. The full hierarchy and monitoring approach are explained in the paper.
The direction of travel
Move steadily from broad averages to verified data on the vehicle, service and operating conditions. As the evidence improves, baselines become more precise and carbon savings can be recognised more accurately.
The full white paper sets out the common framework, the bus and truck applications, the paired illustrative calculations, the proposed CCTS architecture and the near-term options for data, power planning and pilots.
Read the Full White Paper
Request the complete paper for the evidence review, reference calculations and proposed accounting architecture for electric buses and 55 tonne trucks.